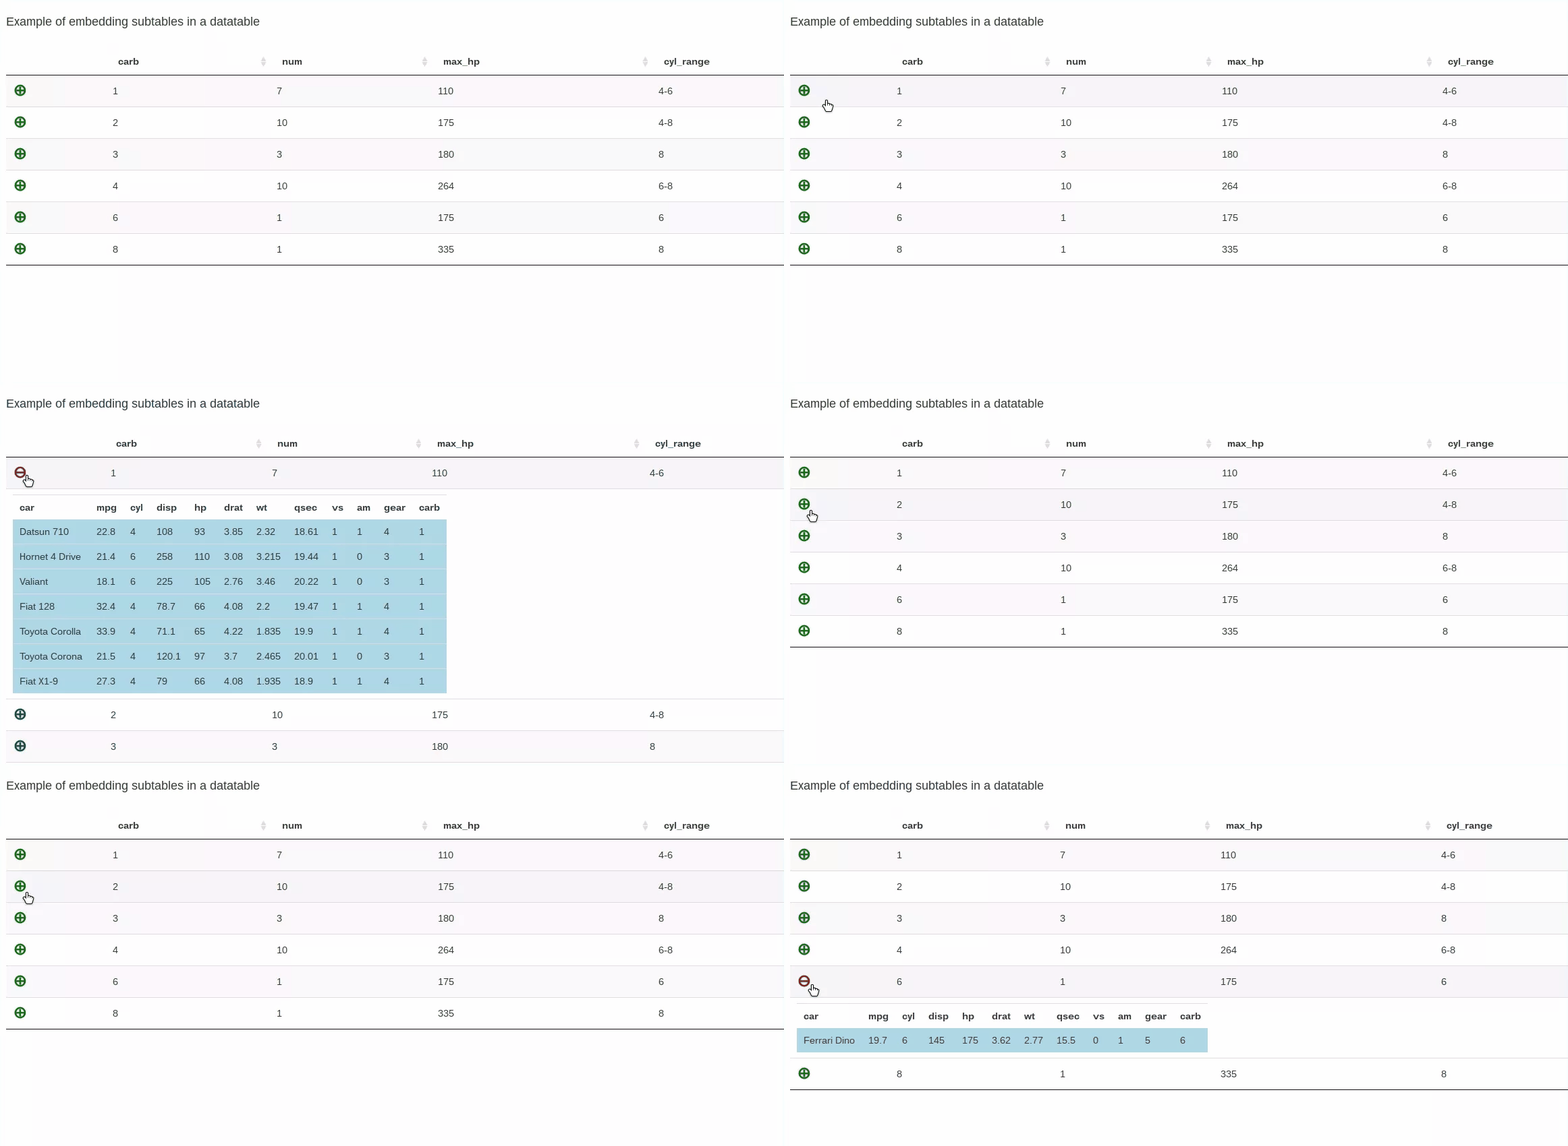
Here’s an example of how to embed subtables in a datatable. It’s an enhancement of the child rows example found at https://rstudio.github.io/DT/002-rowdetails.html and works by storing JSON versions of subtables as a column in the main table dataframe. The current release of the DT library converts the JSON format into a javascript array which can simply be rendered to an HTML table (DT version 1.x returned a JSON string which must be converted using JSON.parse).

##
## EmbeddedTable
##
## Shiny app demonstrating how to embed subtables into a datatable
##
library(shiny)
library(DT)
library(jsonlite)
server <- function(input, output) {
## Generate a data frame containing grouped data
## Subtable is included, formatted as JSON
df.start <- data.frame(car = row.names(mtcars), mtcars, row.names = NULL, stringsAsFactors = FALSE)
l.df <- split(df.start, df.start$carb)
l.cars <- lapply(l.df, function(x) list(num = nrow(x),
max_hp = max(x$hp),
cyl_range = ifelse(min(x$cyl) == max(x$cyl), min(x$cyl), paste(range(x$cyl), collapse = '-')),
subTable = toJSON(x)))
df <- data.frame(carb = names(l.cars), do.call('rbind', l.cars), stringsAsFactors = FALSE)
output$dt1 <- DT::renderDataTable({
DT::datatable(mtcars)
})
## shiny table output
## datatable with expand/collapse buttons
## on expanding, subtable is rendered from JSON to HTML
output$dt <- DT::renderDataTable({
df <- cbind(' ' = '⊕', df)
datatable(
df,
escape = -2,
options = list(
dom = 't',
columnDefs = list(
list(visible = FALSE, targets = c(0, 6)),
list(orderable = FALSE, className = 'details-control', targets = 1)
)
),
callback = JS("
var format = function(d) {
var table = document.createElement('table');
var tableBody = document.createElement('tbody');
var embeddedTableRows = d[6]; // JSON automatically converted to array
var subtable = [];
var arr = [];
$.each(embeddedTableRows, function (index, item) {
arr = [];
$.each(item, function(k, v) {
arr.push(v);
})
subtable.push(arr);
});
// Add table headers
headers = [];
$.each(embeddedTableRows[0], function(k, v) {
headers.push(k);
})
for(var i=0; i<headers.length; i++){
table.appendChild(document.createElement('th')).
appendChild(document.createTextNode(headers[i]));
}
// Add table body
for (var i = 0; i < subtable.length; i++) {
var row = document.createElement('tr');
for (var j = 0; j < subtable[i].length; j++) {
var cell = document.createElement('td');
cell.appendChild(document.createTextNode(subtable[i][j]));
cell.style.backgroundColor = 'lightblue';
row.appendChild(cell);
}
tableBody.appendChild(row);
}
table.appendChild(tableBody);
return(table);
};
// Event handler - expand inner table
table.on('click', 'td.details-control', function() {
var td = $(this), row = table.row(td.closest('tr'));
if (row.child.isShown()) {
row.child.hide();
td.html('⊕').css('color', 'green');
} else {
row.child(format(row.data())).show();
td.html('⊖').css('color', 'red');
}
});"
),
selection = 'none') %>%
formatStyle(1, color = 'green', fontWeight = 'bold', fontSize = '150%', cursor = 'pointer')
})
}
ui <- fluidPage(
br(),
h4('Example of embedding subtables in a datatable'),
br(),
DT::dataTableOutput('dt')
)
shinyApp(server = server, ui = ui)