There are times when we need to perform ANOVA calculations on multiple sets of features in order to generate a list of p-values. A traditional approach is to use the base function aov and extract the p-value from it. This can be slow when analyzing thousands of features. An alternative is to use the multtest library and calculate the p-values from the F-values.
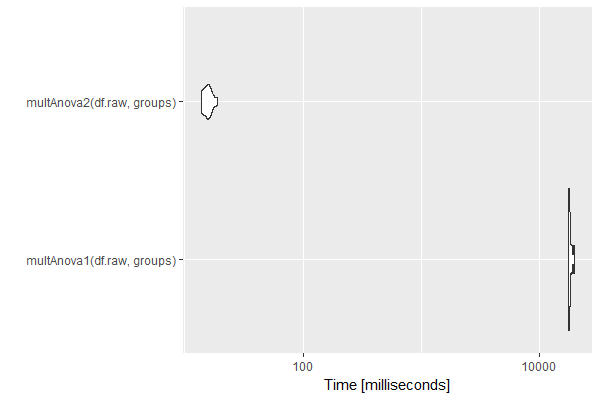
An example is shown below using a matrix of 20 samples (5 groups of 4) and 10000 features. Calculating p-values within an apply loop takes about 18 seconds. Calculating p-values from the F-values using the multtest library takes about 15 milliseconds. Both were determined on a Z640.
## create an (g x s) x f matrix where g is the number of groups, s is the number of samples in each group and f is the number of features
g <- 5
s <- 4
f <- 10000
df.raw <- replicate(g * s, sample(100:100000, f, rep = TRUE))  ## matrix of data
groups <- factor(rep(seq(g), each = s))  ## column ids of groups
## using an apply loop
multAnova1 <- function(df.raw, groups) {
 pVector <- apply(df.raw, 1, function(x) {
   submodel <- lm(x~groups)
   subanova <- aov(submodel)
   summary(subanova)[[1]][['Pr(>F)']][[1]]
 })
 p.adjust(pVector, method='BH')
}

library(multtest)
## using multtest
multAnova2 <- function(df.raw, groups) {
 F_new <- mt.teststat(df.raw, groups, test='f')
 P_new <- pf(F_new, length(levels(groups))-1, length(groups)-length(levels(groups)), lower.tail = F)
 p.adjust(P_new, method='BH')
}

## benchmarking
library(microbenchmark)
library(ggplot2)
mb <- microbenchmark(
 multAnova1(df.raw, groups),
 multAnova2(df.raw, groups),
 times = 10
)
print(mb)
autoplot(mb)
Timing (milliseconds)
| expr | min | lq | mean | median | uq | max | nval |
|---|---|---|---|---|---|---|---|
| multAnova1(df.raw, groups) | 17467.11 | 17609.23 | 18085.73 | 17882.93 | 18203.27 | 19628.12 | 10 |
| multAnova2(df.raw, groups) | 13.89 | 14.25 | 15.66 | 15.68 | 16.31 | 18.72 | 10 |